
Inventory & Planning
The Inventory & Planning module brings live stock levels together with your sales history so you can answer the everyday planning questions: what’s selling, what’s about to run out, what’s sitting too long, and which customers are ordering what. It’s built from two kinds of sales data your admin imports:
- Sell-in — the orders your customers place with you (your order book).
- Sell-through — how those goods sell on at retail, when your customers report it.
Everyone in your organization can open this module and explore it, and the planning grid and analytics are read-only for every role. A few actions are admin-only: importing the underlying sales data and setting up the customer mappings (both covered at the end of this page), plus setting best-seller statuses in the grid (covered under Best Seller Status).
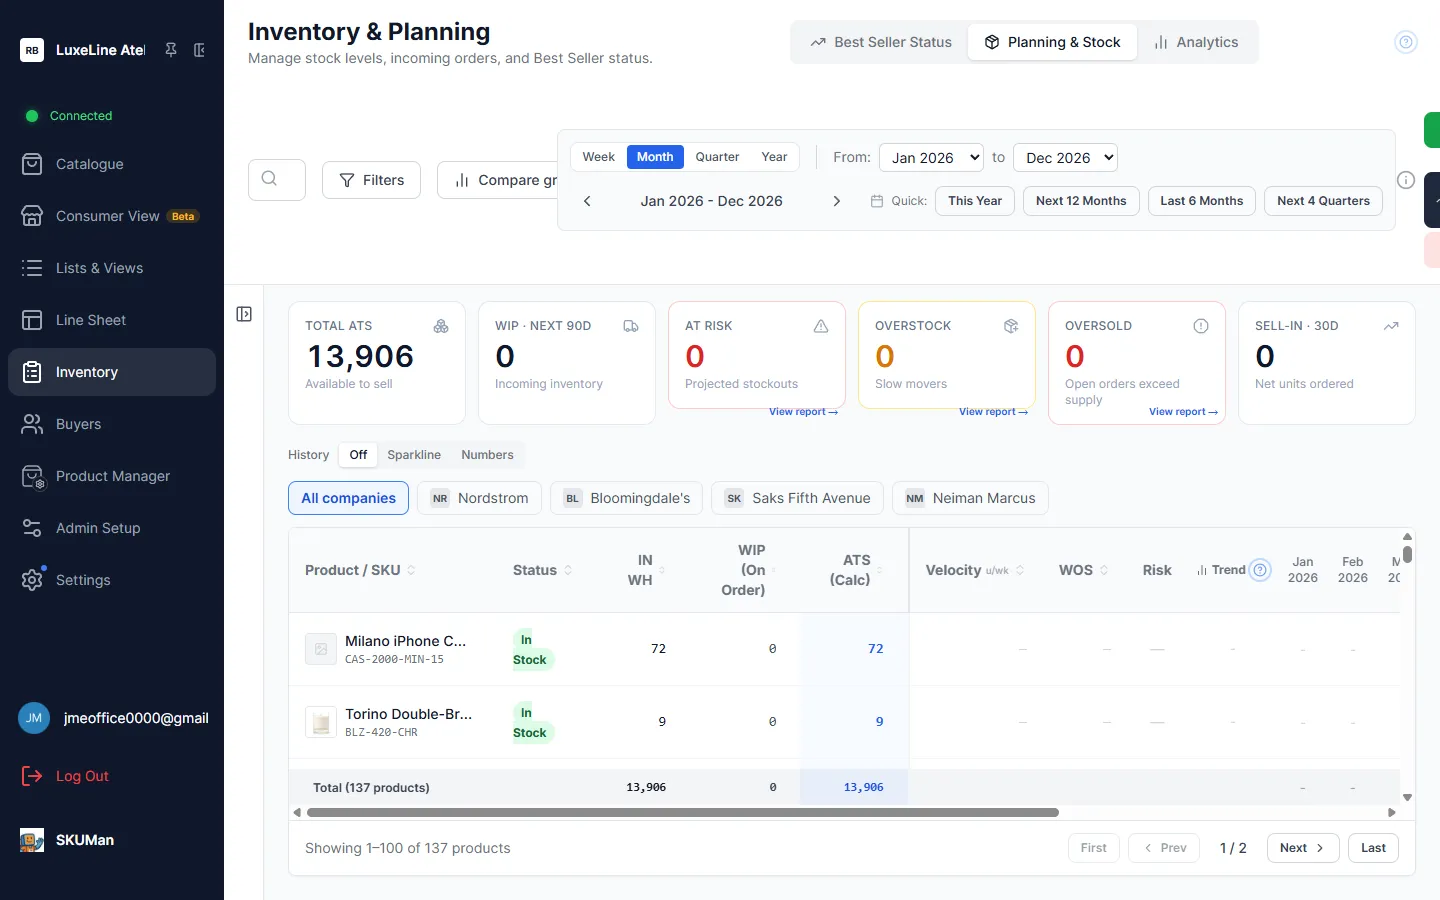
The module has three views, switched from the view switcher at the top:
| View | What it’s for |
|---|---|
| Planning & Stock | The working grid — stock, demand, risk flags, and the KPI summary. |
| Best Seller Status | A per-customer, month-by-month record of what’s a best seller. |
| Analytics | Read-only charts and reports over your full sales history. |
Planning & Stock
Section titled “Planning & Stock”This is the main working grid. It lists every product with its stock position and demand side by side, so a single row tells you both what you have and how fast it’s leaving.
The grid columns
Section titled “The grid columns”| Column | Meaning |
|---|---|
| Warehouse stock | Units on hand in the warehouse right now. |
| On order / WIP | Work-in-progress — units on order or in production, not yet received. |
| ATS | Available to sell — the sellable supply the grid works from. |
| Velocity | Sales speed, expressed as units sold per week. |
| Weeks of supply | How many weeks the current ATS lasts at the current velocity. Shown as unlimited (∞) when there are no recent sales to divide by. |
| Risk flags | Highlights products that are At Risk, Overstock, or Oversold (defined below). |
| Monthly demand timeline | A month-by-month projection of demand across the row. |
You can sort the grid by any column, including Velocity and Weeks of supply — sort by weeks of supply ascending to bring your fastest-emptying styles to the top.
The History toggle
Section titled “The History toggle”The History toggle in the grid header adds recent sales history to each row. It has three settings:
- Off — no history columns (the default).
- Sparkline — a small trend line of the last several periods on each row, with an up/down arrow and percentage.
- Numbers — the same recent history as numeric columns alongside the row.
The history periods follow whichever period length you’ve chosen in the period picker.
Search, filters, and scoping to one customer
Section titled “Search, filters, and scoping to one customer”The Planning grid uses the same search box and filter sidebar as the main catalogue — brand, season, category, custom fields, price and inventory ranges, and so on all work here. See The Catalogue for how the filters and per-value counts work; the behavior is identical. (The Planning grid and the catalogue keep their filters separate, so narrowing one doesn’t disturb the other.)
Two extra controls sit above the grid:
- Company chips scope everything — demand, velocity, risk, and the KPI tiles — to a single customer. This lets you plan for one account at a time. Companies come from the Buyers module.
- The period picker (week / month / quarter / year) sets the length of each bucket in the demand timeline and the history columns.
The KPI tiles
Section titled “The KPI tiles”The tiles across the top summarize the current, filtered view. Total ATS and WIP next 90d reflect exactly what the grid is showing after all your filters. Sell-in 30D is a separate sales-volume figure scoped only to the selected company (through the company chips), so it doesn’t move with your other filters. The three risk tiles count flagged products across your search and filters but stay steady while you toggle a risk filter on and off, so the numbers don’t jump around as you drill in.
| Tile | What it counts |
|---|---|
| Total ATS | Total available-to-sell units across the products in view. |
| WIP next 90d | Incoming inventory scheduled to arrive in the next 90 days. |
| At Risk | Products projected to stock out based on current velocity. |
| Overstock | Slow movers carrying an excessive number of weeks of supply. |
| Oversold | Products where committed open orders exceed available supply. |
| Sell-in 30D | Units sold in over the last 30 days (scoped by the selected company). |
Filtering by risk, and the risk reports
Section titled “Filtering by risk, and the risk reports”Click any of the three risk tiles — At Risk, Overstock, or Oversold — to narrow the grid to exactly those products. The active tile is highlighted; click it again to clear the filter.
Each risk tile also carries a View report → link. That jumps you to the Analytics view with the matching Risk Report open, where every affected product is broken out in detail. Expand any product in the report to see its open order lines — the individual outstanding orders — and, for oversold and at-risk products, which incoming delivery (if any) covers each line. The coverage is worked out in delivery-date order: on-hand stock is allocated first, then each incoming delivery in turn, so every open line is marked as covered (with the date it’s covered by), partly covered, or uncovered. That tells you at a glance whether a shortfall is already on its way in or genuinely short.
Compare groups
Section titled “Compare groups”In the Planning & Stock view, the Compare groups button lets you aggregate products into groups and chart their sell-in against each other — for example “polka-dot cases” versus “food-print cases”, or one brand versus another. It opens the Group Comparison section of the Analytics view (described below).
Best Seller Status
Section titled “Best Seller Status”Best-seller tracking records, for each product and each customer, whether that product is a best seller in a given month. It answers “which styles are winning, and for whom” over time, independent of raw order volume.
Each product × customer × month cell holds one of three statuses:
| Status | Meaning |
|---|---|
| YES | A best seller for that customer that month. |
| MID | A moderate performer. |
| NO | Not a best seller. |
A product’s current status is simply its most recent monthly status within the last twelve months for that customer — so a status set in a quarterly review stays put until you record a newer one, rather than flickering between updates.
Choosing which customer’s best sellers you’re viewing depends on the Buyers module, since best sellers are tracked per company.
Setting statuses
Section titled “Setting statuses”Admins can set a status directly in the grid: click a cell to cycle it through YES → MID → NO → blank (unmarked), then back to YES. Everyone else sees the statuses read-only.
For bulk changes, admins can import statuses from a spreadsheet and export the current matrix back out — the fastest way to update many products or customers at once after a monthly or quarterly review.
Automatic suggestions
Section titled “Automatic suggestions”The module also suggests best sellers automatically: it surfaces your top recent sell-in movers that aren’t already marked YES, so you can promote the ones you agree with without hunting for them.
Where best sellers show up
Section titled “Where best sellers show up”Recorded best sellers feed two other places in SKUMan:
- The Best Sellers filter in the catalogue, so you can narrow the grid to current best sellers.
- A best-seller badge and field on line sheets, including a “Best sellers only” filter when you build a sheet for a specific buyer.
Analytics
Section titled “Analytics”The Analytics view is your read-only reporting workspace. Nothing here changes your data — it aggregates your sales history into charts and reports. It has four sections.
Sales History Explorer
Section titled “Sales History Explorer”Chart sell-in over time. Choose what to plot in one of two ways:
- Specific products — search for and pick the individual styles you want, or
- A whole field group — for example a brand, a season, a category, or a tag, so every product in that group is rolled up together.
Then set the granularity (week / month / quarter / year) and the date range. The chart draws the sell-in series with a trend line overlaid so the direction is obvious, and — where sell-through data exists for the selection — it can overlay sell-through too. Summary stat cards show totals, the average per period, the trend percentage, and the peak period.
Group Comparison
Section titled “Group Comparison”Compare up to eight groups side by side on one chart. Define each group either by a field value (a brand, a category, a tag…) or by a search query, and matched variants are automatically expanded to their full styles so a group is counted as complete styles rather than stray sizes. You can switch chart types, save a comparison to reuse later, and export the comparison to Excel. (This is the same section the Planning grid’s Compare groups button opens.)
Rep Breakdown
Section titled “Rep Breakdown”See sell-in summarized by sales rep — a leaderboard of units per rep plus a chart of each rep’s performance over time. Useful for reviewing coverage and momentum across your team.
Risk Reports
Section titled “Risk Reports”Three tabs — Oversold, At Risk, and Overstock — give the detailed backing for the Planning view’s risk tiles (this is where the View report → links land). Each report lists the affected products with the numbers behind the flag. Expanding an oversold or at-risk product reveals its open order lines and their delivery coverage, exactly as described under Filtering by risk. Each report can be exported to Excel.
Where the data comes from
Section titled “Where the data comes from”Two streams feed this module:
- Stock and product data — warehouse stock, on-order quantities, and incoming deliveries — come in with your regular product imports.
- Sales history — your sell-in order books and any sell-through reporting — is imported by your admin.
Admins have three ways to bring sales history in:
- Spreadsheet drops — upload a CSV or Excel export directly in the app.
- The SKUMan Sync desktop app — drop sales files into a watched folder and they upload automatically; Sync recognizes a sales file on its own.
- An ERP integration through the External API, for a fully automated feed.
Whichever route is used, imports run against your customer list, so admins first map any unrecognized customer names to companies in the Buyers module. After that, everyone in your organization can open Inventory & Planning and explore — the analysis is read-only for every role, and only the imports and mappings are admin-only.